This essay is the second of a series written by Achim Goerres for the project “Ageing Democracies? Political Participation and Cultural Values Among the Elderly in Europe” financed by the Open Society Foundation. The complete project report with all essays and the reports written by the other project members can be found here.
At the onset of many liberal democracies, participation in democratic elections was the only political action that citizens would engage in. All other forms of political participation were extremely rare. This has changed dramatically since the 1970s in Europe.
In mainstream political science, political participation is an individual action intended to affect political outcomes. These outcomes can be policies, political institutions or the selection of political personnel. Purely expressive actions, such as waving a flag, do not fall under this definition. Within this definition, there are a wide variety of different political actions. Here, we will only look at four that are among the most common forms of low-intensity political participation: voting, contacting a public official or politician, signing a petition and taking part in a demonstration. They are low-intensity forms of participation because they require relatively low levels of cognitive and physical abilities. The first two are often called institutionalised political participation, since they involve the use of formalised institutions of representative democracy. The second two are often called non-institutionalised participation, since they do not require formalised forms of participation.
Political participation is changing across Europe in manifold ways that vary from country to country. Broadly, individuals are becoming less willing to subscribe to whole manifestoes of political goals, such as those offered by political parties. Instead, they are increasingly interested in single political issues, such as the protection of the environment. There is also less willingness to attach oneself to a specific type of political participation in the long run. This makes non-institutionalised forms of political participation increasingly popular. Voting and some forms of institutionalised participation, like party activism, are on the decline. This is not true for all countries and all parties, but the tendency is clearly there. Across European countries, the levels of non-institutionalised participation seem to depend on the length of democratic epoch in a country. As I will show below, the longer ago the transition to democracy was, the more common non-institutionalised forms of participation are.
How we participate in politics is linked to the patterns we observe today and what we first learned when we were more impressionable young adults. This is a typical cohort phenomenon, wherein older people are different because they belong to a certain birth cohort who shared different social and political experiences at a young age. This is not a deterministic relationship, however. There are certainly very active older people in non-institutionalised forms of participation. But generally, today’s older people use these forms less because these forms of participation were less common when they grew up. Nonetheless, this particular participation gap between older and young people is closing. In 1981, the non-institutionalised participation rate of older men in Western Europe was roughly 46% that of men under the age of 30. By 2000, this ratio had risen to 84%. Among women, the change was from 24 % to 52 % over the same time period (Goerres 2009: 129). As I will show below, there are even some European countries, such as Switzerland or Sweden, where the gap has reversed and older people are now more likely to use forms of non-institutionalised participation than young people.
That the manner of the overall participation process is changing is not only remarkable as such, but it carries an inherent message about social inequalities. High-frequency forms of political participation, such as voting, are less unequal than low-frequency forms of participation in terms of the social profile of those who resort to them. Moreover, non-institutionalised forms of participation are also higher education forms of political participation. So even though these forms are becoming more popular, they have a strong bias against people with a lower educational level than voting does. Thus, if older people are more likely to use institutionalised forms of participation such as voting, the social representation of older people is less biased than that of young people, who are more likely to use high-bias forms of participation. The effects of these differences on representation bias are fairly unexplored.
Let us examine age differences in political participation in more detail. We start by identifying four groups: (1) those who are inactive politically (Not active), meaning that they do not engage in any form of political activity; (2) those who only use non-institutionalised forms of participation (only non-institutionalised participants); (3) those who vote and do nothing else (Only Voters); and (4) those who vote and do at least one other activity, whatever that may be (Vote Plussers). For those groups, we use four different political actions that will also form the basis of the more nuanced analysis to follow: voting, contacting a public official or politician, signing a petition and demonstrating in the streets.
Table 1: Types of political participation across age groups in Europe
|
Not Active
|
Only Non-Institutionalised Participants
|
Only Voters
|
Vote Plussers
|
Total
|
|
Older People (60+ yrs)
|
13
|
2
|
57
|
28
|
100
|
|
Middle-aged (30-59 yrs)
|
17
|
6
|
42
|
36
|
100
|
|
Young (18-29 yrs)
|
28
|
9
|
36
|
27
|
100
|
|
Across all Age Groups
|
17
|
5
|
46
|
32
|
100
|
Table 1 shows the four activity groups across 27 European countries weighed by their population size. If you want to know just four numbers for the political participation of older Europeans in free European democracies, they can be found in the first row. Thirteen percent of older people in Europe are not politically active at all. Though this may seem like a lot, it is very little compared to the 28% of young people or the 17% of middle-aged people in Europe who do not participate. Meanwhile, only using non-institutionalised forms of participation is preferred by only a small fraction (2%) of older people. Among the young, however, 9% only use non-institutionalised forms of participation. Taken with the 28% of totally inactive young people, this means that nearly two-fifths of the European youth are not inside the electoral process.
In contrast, the majority of older people (57%) only participate in politics by voting, substantially more than the 42% among the middle-aged or the 36% among the young who participate in this way. Interestingly, however, 28% of older people use voting and at least one other form of political participation, a number that is very similar among the youngest group (27 %), but much lower than for the middle-aged (36%). Thus, it can be said that older people are much more firmly placed inside the electoral process than other age groups (85%), but that the middle-aged show more strength among the vote-plussers. The young are clearly the least active of the three age groups.
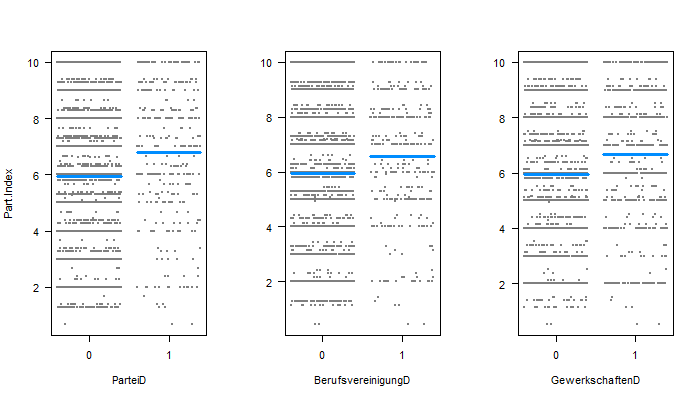
Figure 1: Distribution of activity types across European countries and Europe
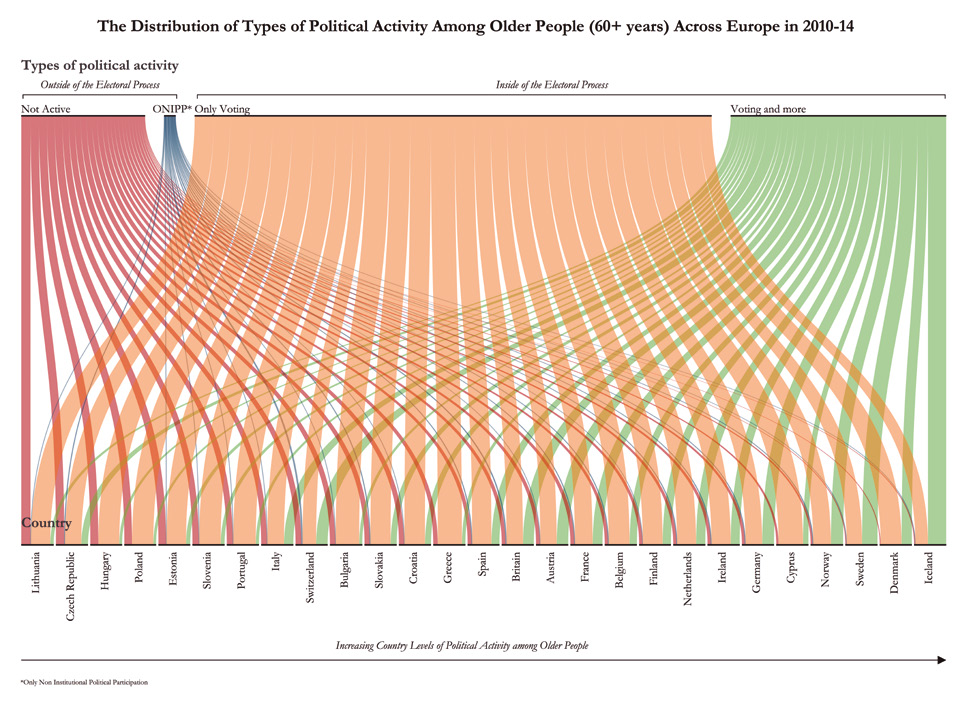 Figure 1 reveals the distribution of these four political activity groups across all 27 European countries. Lithuania has the least politically active older people whereas Iceland has the most active older people on the right. Those who only vote are the dominant activity is most European countries. Those who are active but outside of electoral politics constitute a small fraction in all European countries.
Institutionalised political participation across countries
Let us now turn to some detailed cross-country comparisons. This statistical analysis is based on all European countries that were in the European Social Survey between 2010 and 2014 and considered free democracies, a total of 27 countries. For some countries we have data from three different surveys and for others just from one.
The self-reported voting participation of older people (60+) has a minimum of 70% in Lithuania and a maximum of 96% in Denmark, with a mean of 84% (see Table 2). So while older people have high voter participation rates across Europe, there are strong differences between older people in different countries.
When we look at the ratio of elderly voting participation and young (ages 18-29) voting participation , we see that the ratio stands almost exactly at 1.0 for Italy and Belgium, meaning that in these two countries the voting rates for the two age groups are the same. This makes sense because both countries have mandatory voting with either weak enforcement (Italy) or strong enforcement (Belgium). However, for all other countries, the ratio is above 1 with an average of 1.38 and a maximum of 2.07 in Lithuania. This means that older people in Lithuania are 2.07 times more likely to vote than young people.
Overall in Europe, older people are more likely to vote than young people. The reasons for this are well-known. First, as voters have had more opportunities to vote, they get used to voting (Goerres 2007). The occasional non-voter tends to become a regular voter. This is an age effect that is likely to linger for some time to come. In addition, in many countries older people belong to cohorts that were socialised into a stronger sense of duty to vote compared to more recent cohorts (Franklin 2004). This is a historical trend that can reverse. It could be that, in the future, members of older cohorts will have a lower likelihood of voting than younger cohorts.
Table 2: Voting participation by age groups
|
Country Name
|
Country Code
|
Overall
|
Level among older people (60+)
|
Level among middle-aged (30-59 yrs)
|
Level among young (18-29 yrs)
|
Ratio old to young
|
|
Lithuania
|
LT
|
59
|
70
|
60
|
34
|
2.07
|
|
Britain
|
GB
|
71
|
85
|
70
|
44
|
1.92
|
|
Croatia
|
HR
|
75
|
83
|
81
|
43
|
1.91
|
|
Ireland
|
IE
|
74
|
88
|
77
|
48
|
1.83
|
|
France
|
FR
|
73
|
86
|
71
|
48
|
1.78
|
|
Switzerland
|
CH
|
66
|
77
|
65
|
46
|
1.68
|
|
Austria
|
AT
|
77
|
87
|
77
|
59
|
1.47
|
|
Cyprus
|
CY
|
83
|
92
|
84
|
63
|
1.47
|
|
Czech Republic
|
CZ
|
63
|
71
|
63
|
49
|
1.44
|
|
Slovenia
|
SI
|
71
|
79
|
72
|
55
|
1.44
|
|
Portugal
|
PT
|
72
|
80
|
70
|
58
|
1.39
|
|
Iceland
|
IS
|
89
|
95
|
91
|
71
|
1.34
|
|
Bulgaria
|
BG
|
77
|
82
|
76
|
62
|
1.34
|
|
Slovakia
|
SK
|
75
|
81
|
76
|
61
|
1.33
|
|
Estonia
|
EE
|
70
|
74
|
72
|
56
|
1.32
|
|
Finland
|
FI
|
83
|
88
|
82
|
69
|
1.28
|
|
Netherlands
|
NL
|
83
|
88
|
83
|
69
|
1.27
|
|
Greece
|
GR
|
81
|
86
|
82
|
69
|
1.24
|
|
Poland
|
PL
|
70
|
75
|
71
|
61
|
1.22
|
|
Norway
|
NO
|
88
|
92
|
89
|
76
|
1.22
|
|
Spain
|
ES
|
80
|
85
|
80
|
70
|
1.22
|
|
Hungary
|
HU
|
73
|
74
|
77
|
61
|
1.21
|
|
Germany
|
DE
|
83
|
88
|
83
|
73
|
1.20
|
|
Denmark
|
DK
|
93
|
96
|
94
|
81
|
1.19
|
|
Sweden
|
SE
|
92
|
95
|
93
|
84
|
1.13
|
|
Italy
|
IT
|
82
|
80
|
84
|
77
|
1.04
|
|
Belgium
|
BE
|
89
|
88
|
90
|
90
|
0.97
|
|
|
|
|
|
|
|
|
Mean
|
|
78
|
84
|
78
|
62
|
1.41
|
|
Minimum
|
|
59
|
70
|
60
|
34
|
0.97
|
|
Maximum
|
|
93
|
96
|
94
|
90
|
2.07
|
In Figure 2, we can see that the relationship between the ratio of voting levels is strongly correlated with the overall level of reported voting participation. The more common voting is in a country, the smaller the difference is. This is in parts a mechanical effect. If an activity is almost carried out by everyone, sizeable groups in that country cannot differ much in their activity levels. In other words, if the voting differential in participation between young and old is seen as a problem, increasing the overall turnout will tend to narrow the gap here.
Figure 2: Scatter plot overall level of reported voting and ratio of the levels of older people and young people
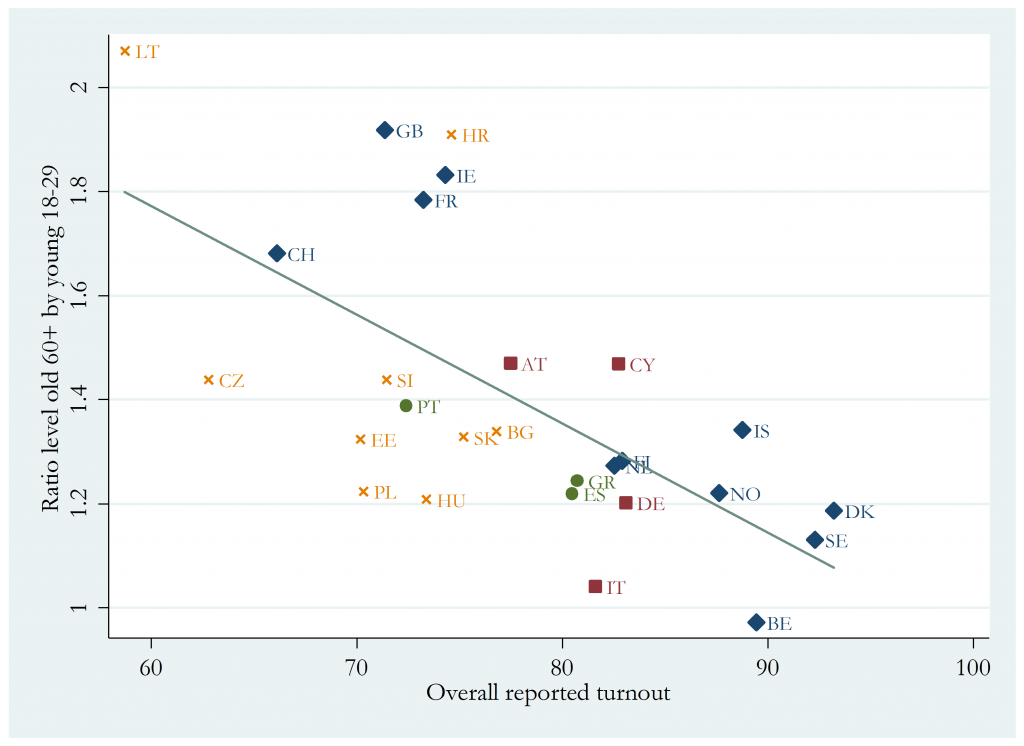 Legend: Diamonds=Democracies since before 1945, rectangles=democracies since after 1945 and before 1961, circles=democracies since the 1970s, crosses= democracies since 1989. For country acronyms, see Table 2.
Figure 2 also shows the timing of democratisation in each of these countries. Countries that democratised after 1989 tend to have lower levels of voter turnout overall and a stronger distortion of voting in favour of older people. In other words, more recent democracies are characterised by a voting process in which older people play a disproportionally stronger role compared to young people.
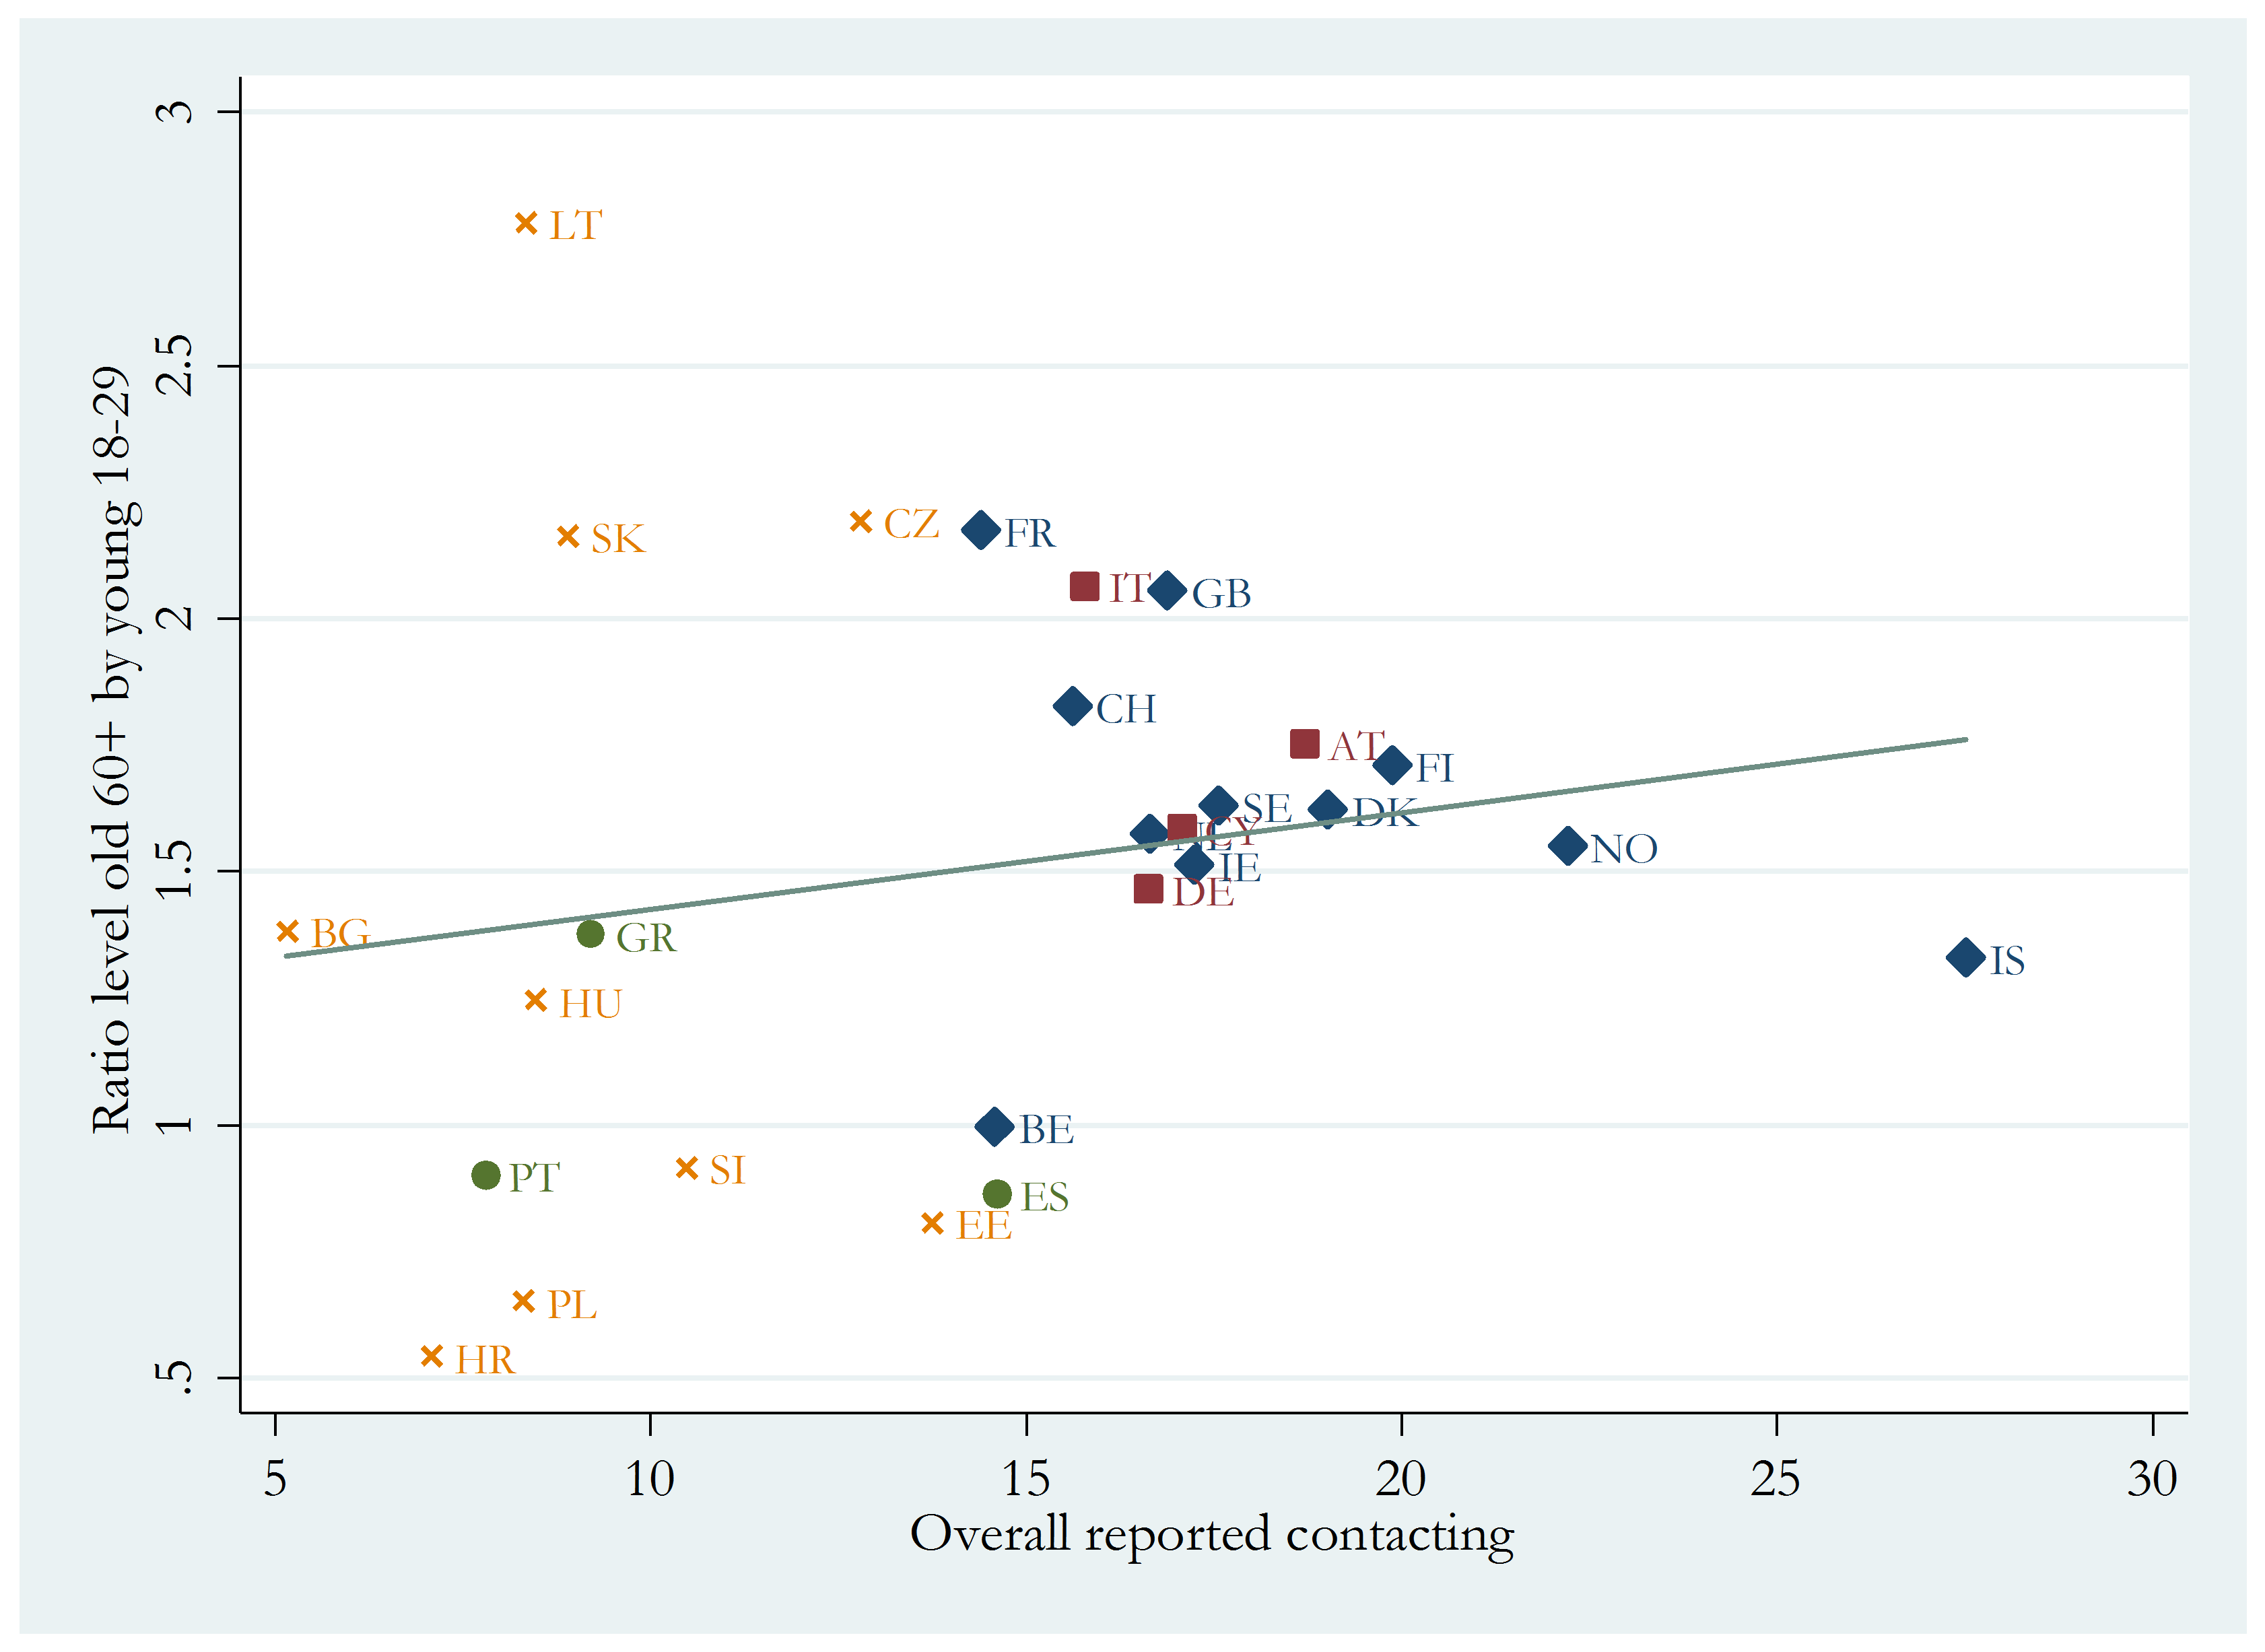
Let us turn to the second type of institutionalised political participation (Table 3, with more detailed results in the appendix). Whether people contacted a politician or public official varies a lot between countries. It is used very little in Bulgaria (5%) and very much in Iceland (28 %), with an overall average of 14%. Among older people, Croats are the least likely to use that channel (4%) compared to older Icelanders (26%).
When we look at the ratio between the participation level of older people divided by that of young people, we see much more dramatic cross-country differences than we did for voting participation. Six countries show a pattern in which older people are less likely to use this channel of participation. Croatia, for instance, has a ratio of only 0.54, meaning older Croats are 46% less likely to use this form of political action than young Croats. Meanwhile, in Belgium there is absolutely no difference. In contrast, older people were more likely to use this channel in 20 countries. The maximum is in Lithuania, where older people are 2.78 times more likely to contact their public officials than young people.
Table 3: Contacting a Public Official or Politician by Age Group
|
Overall
|
Level among older people (60+)
|
Level among middle-aged (30-59 yrs)
|
Level among young (18-29 yrs)
|
Ratio old to young
|
|
Mean
|
14
|
13
|
17
|
9
|
1.51
|
|
Minimum
|
5
|
4 (Croatia)
|
5
|
3
|
0.54 (Croatia)
|
|
Maximum
|
28
|
26 (Iceland)
|
31
|
19
|
2.78 (Lithuania)
|
For details, see the appendix.
Figure 3: Scatter plot of the overall reported level of contacting a public official or politician and the age ratio
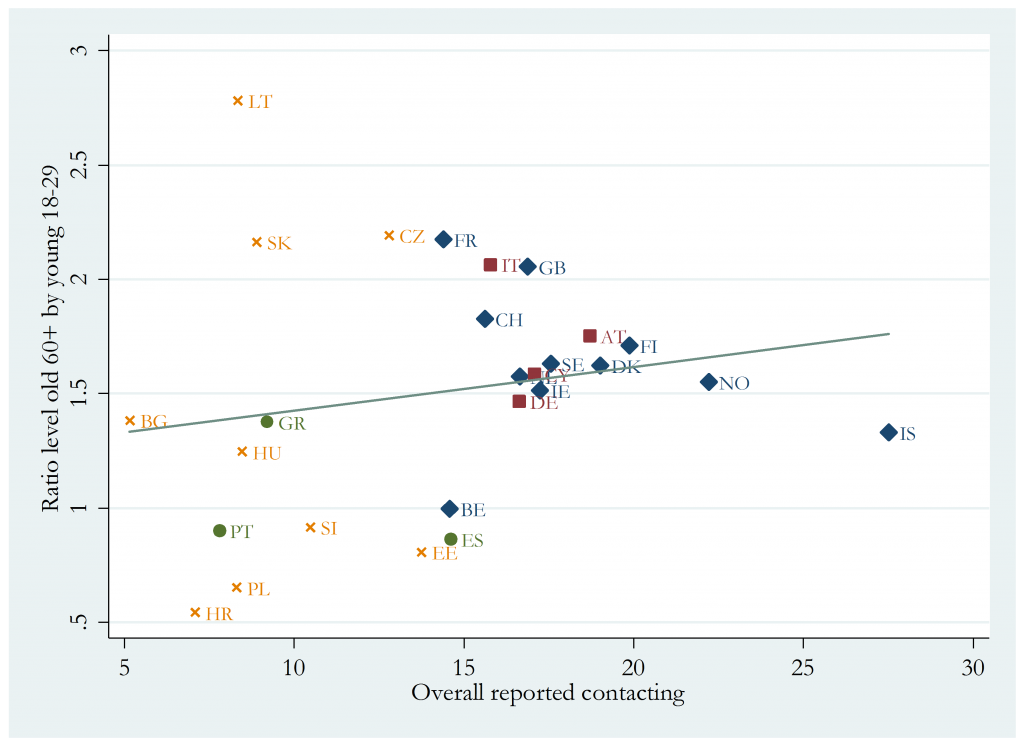
Diamonds=Democracies since before 1945, rectangles=democracies since after 1945 and before 1961, circles=democracies since the 1970s, crosses= democracies since 1989. For country acronyms, see Table 2.
Figure 3 shows that there is almost no relationship between the overall level of contacting public officials and politicians and the ratio level of elderly to young people. The fitted line is almost flat. However, we do see that older democracies (i.e. those that have existed since either before Wold War II or shortly after) cluster on the right-hand side of the graph. This means that they have higher levels of contacting public officials and are less heterogeneous in terms of the ratio of elderly to young people using this form of participation. In more recently democratised countries, the level of contacting tends to be lower and the distortion of usage varies dramatically.
Non-institutionalised participation
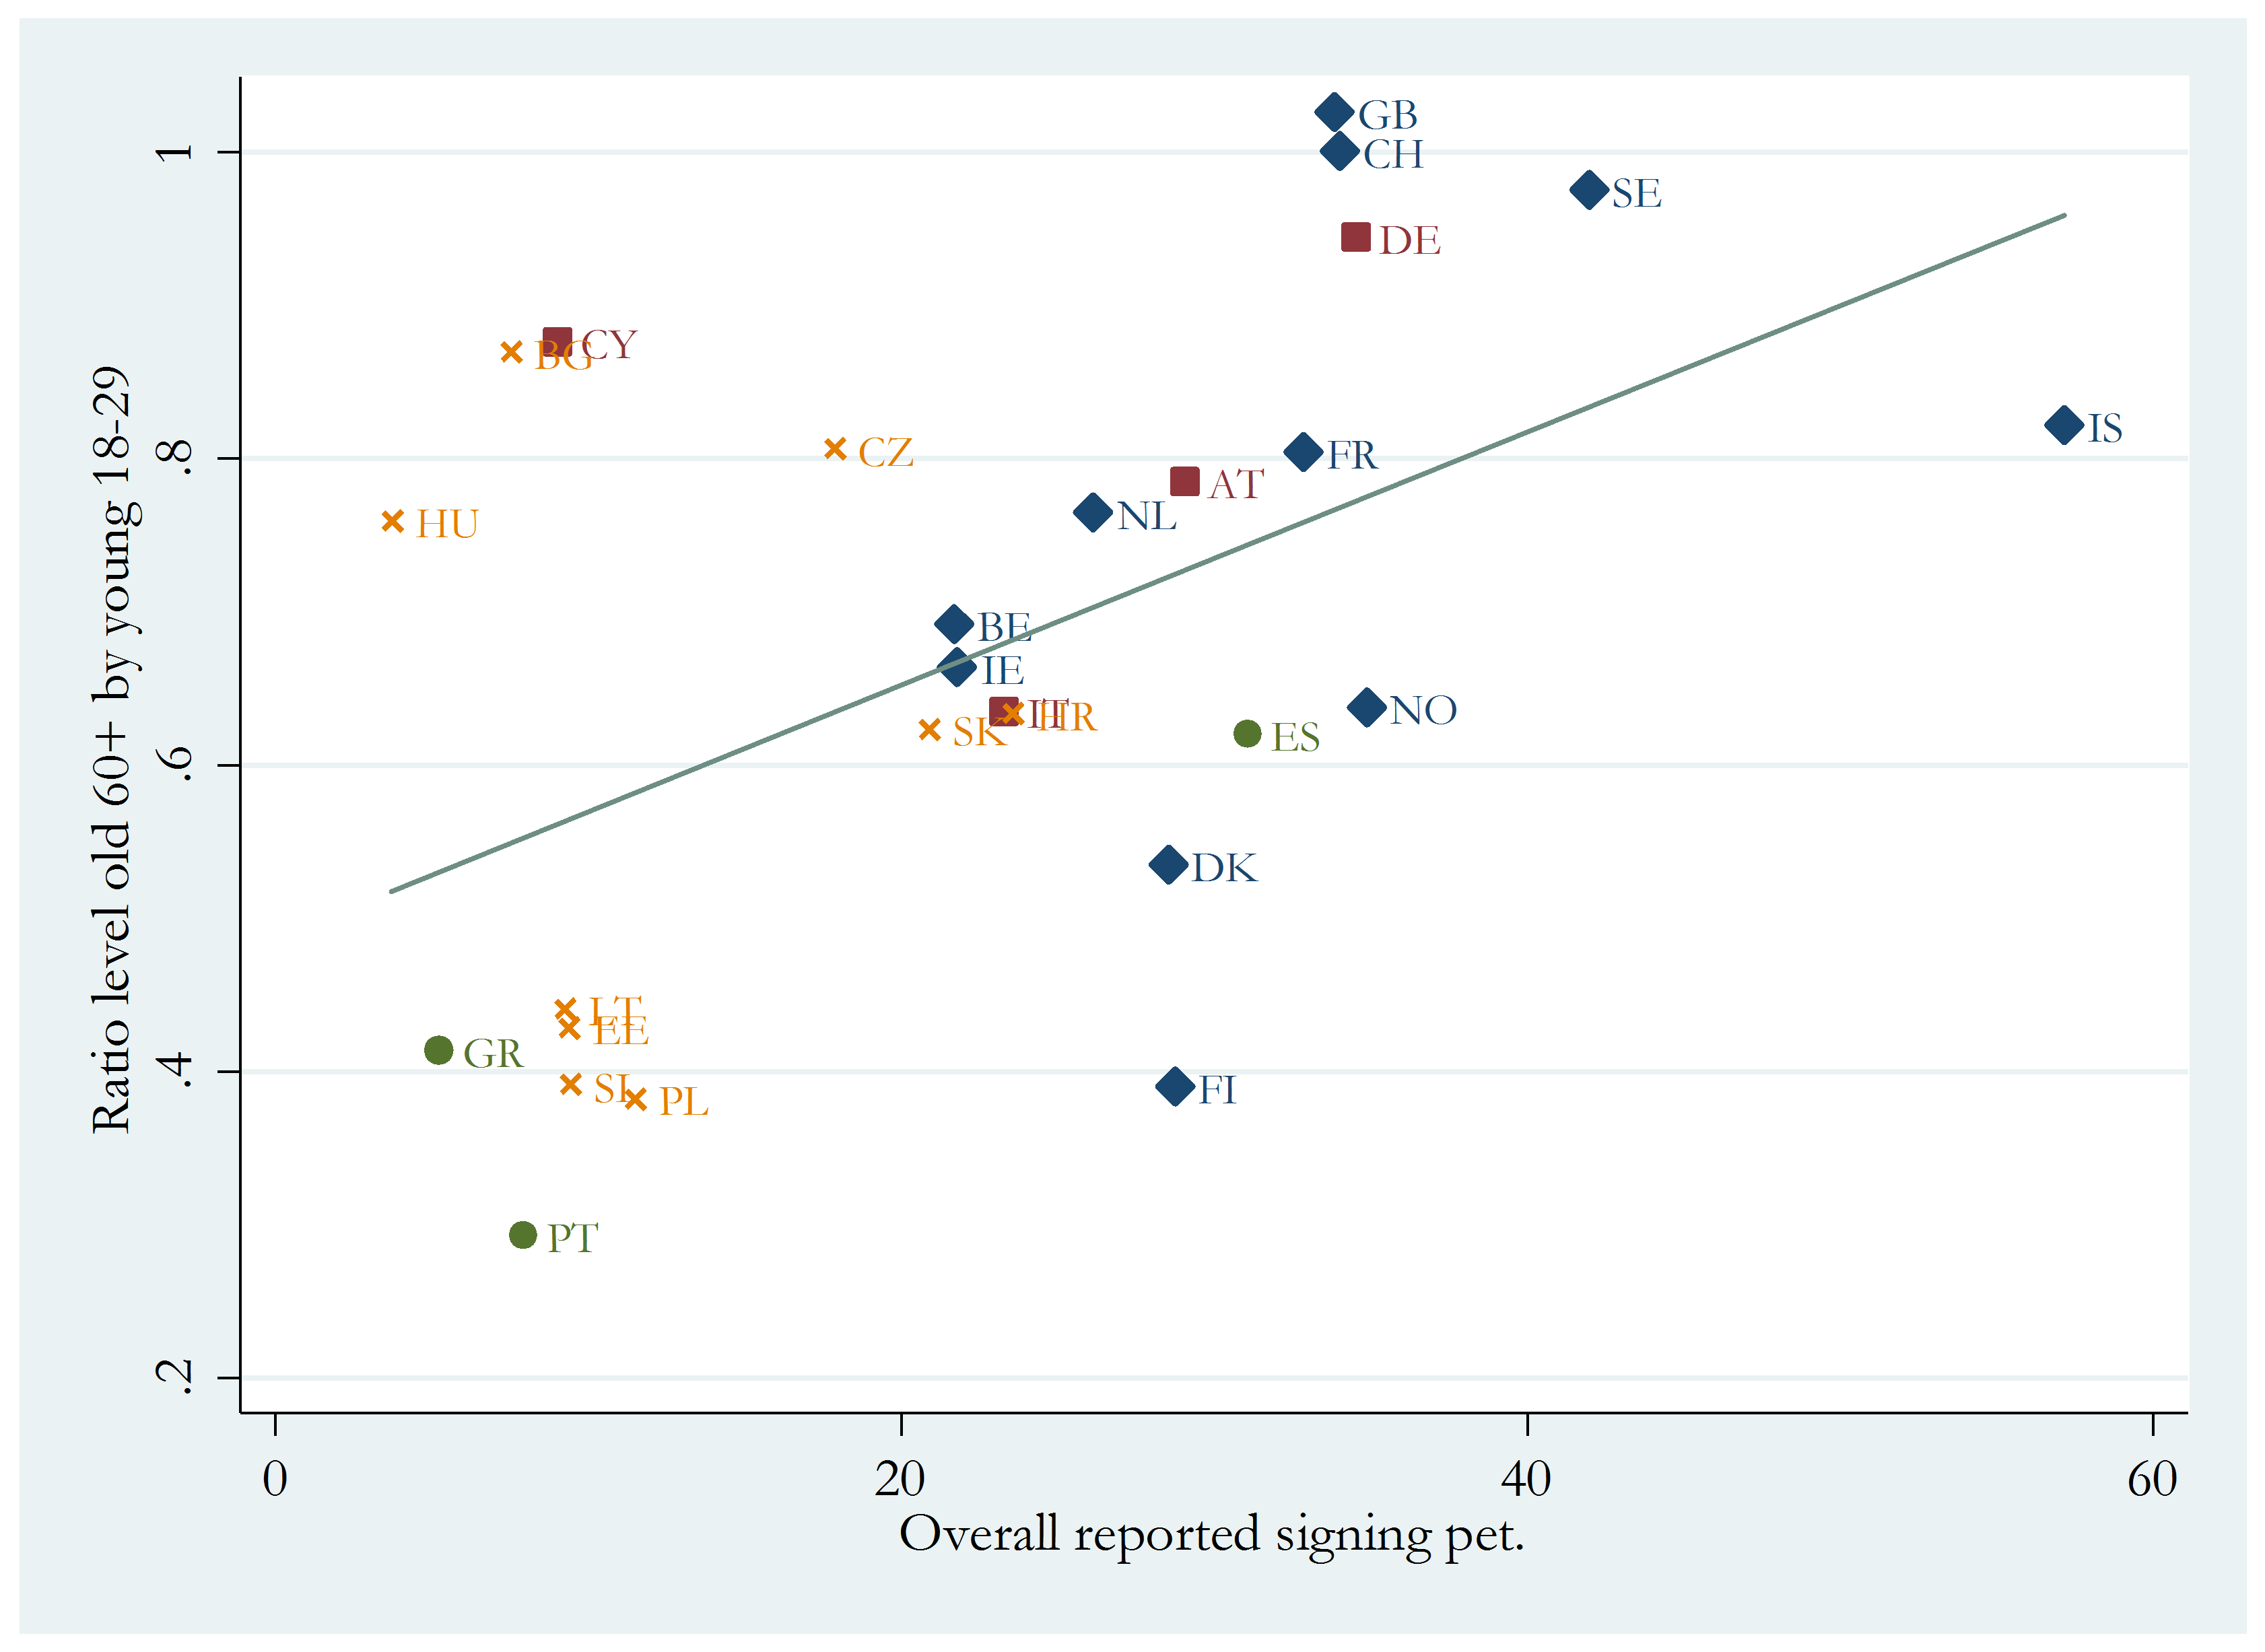
Signing a petition is the most common form of political participation outside of the established formal channels (Table 4). Here, the range of country averages is very large. Forty six percent of older Icelanders said they had signed a petition in the previous 12 months, compared to only 3% in Hungary and Greece. The ratio is on average tilted below 1 with a mean of 0.69, a minimum of 0.29 in Portugal and a maximum of 1.03 in Switzerland. Of the 27 countries in our sample, 25 reveal a ratio below 1, meaning that older people in Europe are less likely to use this form of political participation.
Table 4: Signing a petition by age group
|
Overall
|
Level among older people (60+)
|
Level among middle-aged (30-59 yrs)
|
Level among young (18-29 yrs)
|
Ratio old by young
|
|
Mean
|
23
|
17
|
25
|
24
|
0.67
|
|
Minimum
|
4
|
3 (Hungary, Greece)
|
4
|
3
|
0.29 (Portugal)
|
|
Maximum
|
57
|
46 (Iceland)
|
63
|
56
|
1.03 (Switzerland)
|
See the appendix for detailed results.
Figure 4: Scatter plot of the overall level of signing a petition and the age ratio
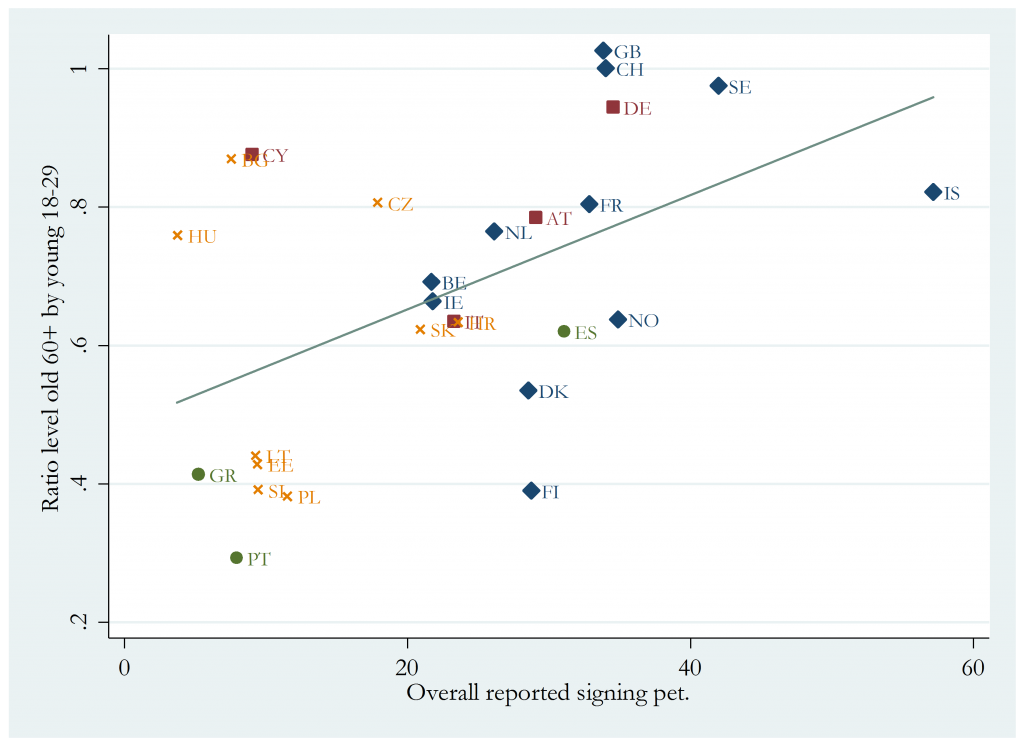 Diamonds=Democracies since before 1945, rectangles=democracies since after 1945 and before 1961, circles=democracies since the 1970s, crosses= democracies since 1989. For country acronyms, see Table 2.
In Figure 4 we see that, in contrast, to voting there is a distinct positive relationship between the overall level of this form of political participation and the ratio. This means that the more common signing a petition is in a country, the less difference there is between whether young and older people participate in this way. At the bottom-left of the figure, we can see a cluster of six countries (Estonia, Greece, Lithuania, Poland, Portugal and Slovenia) that are all characterised by low levels of this form of participation and a low ratio of older to young participation. Here, signing a petition is predominantly carried out by young people and not at all by older people.
Demonstrating in the streets is another form of non-institutionalised participation that is much less used and more demanding in terms of time and energy than just signing a petition. In previous studies of the 1970s, demonstrating was considered a youth thing. This finding has now been partially revised. Demonstrating in the streets is far more common in countries such as Spain or Iceland, especially compared to places like Finland or the Netherlands. This is reflected among older people, too, with the highest participation rate being that of older Icelanders (16%). Meanwhile, in the Netherlands, Finland or Slovenia, only 1% of the elderly took part in demonstrations. In most countries (26 of the 27 in our sample), demonstrating in the streets is predominantly carried out by young people and not by older people. In Iceland, older people are resorting to street demonstrations as much as young people with the ratio at exactly one. The gap between young and older people, however, varies quite substantially across countries.
Table 5: Taking part in a demonstration by age group
|
Overall
|
Level among older people (60+)
|
Level among middle-aged (30-59 yrs)
|
Level among young (18-29 yrs)
|
Ratio old by young
|
|
Mean
|
7
|
5
|
8
|
9
|
0.53
|
|
Minimum
|
2
|
1 (Finland, Netherlands, Slovenia)
|
2
|
3
|
0.16 (Finland)
|
|
Maximum
|
22
|
16 (Iceland)
|
25
|
28
|
1.00 (Iceland)
|
Figure 5 displays the overall level of demonstrating in a country and the participation ratio of older to young people. There is a positive association between the two, but not a very strong one. The more common demonstrating is, the less difference there is between older and young people. The less popular this form of participation is, the more it is carried forward by young people. There is no discernible relationship between the timing of democracy here: countries from all groups can be found everywhere. Two interesting countries stand out, Iceland and Spain. Both show a very high level of participation in demonstrations (18 and 22%). But in Iceland, older people and young people have the same level of participation, thus showing an age gap of zero. In contrast, Spain shows a significant age gap, with the ratio standing at 0.48. Older Spanish people are 52% less likely to demonstrate compared to the level of young Spanish people. Even though both countries show high levels of demonstration, in Spain this is carried out much more by young people than it is in Iceland where this kind of political action is equally popular among young and older people.
Figure 5: Scatter plot overall level of demonstrating and the age ratio
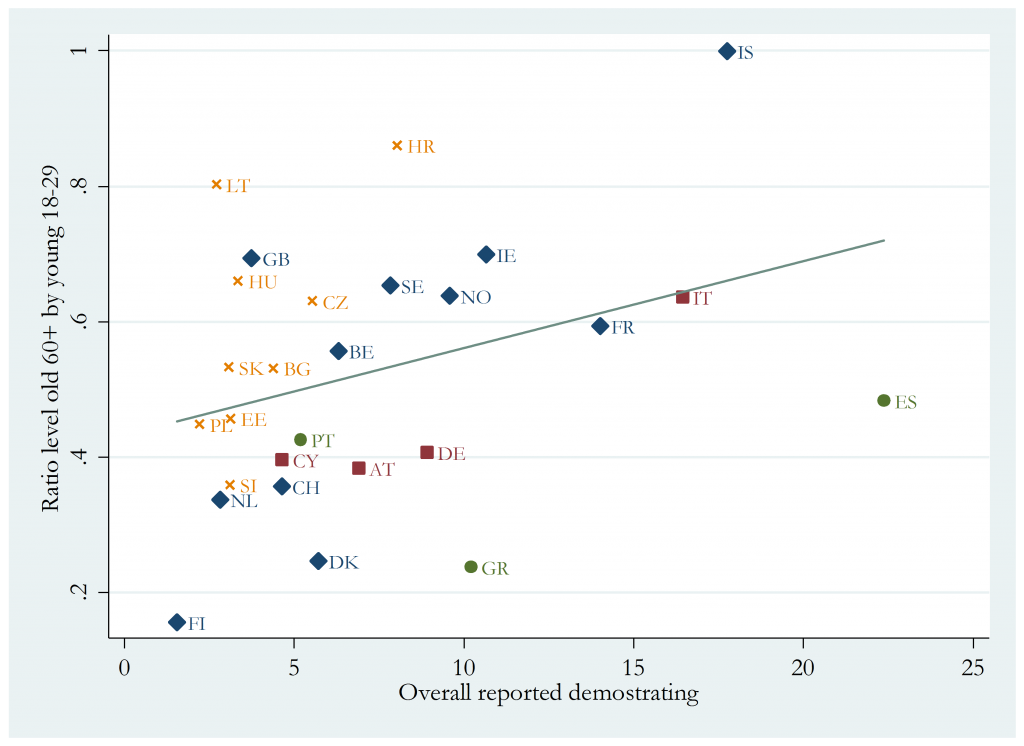 Diamonds=Democracies since before 1945, rectangles=democracies since after 1945 and before 1961, circles=democracies since the 1970s, crosses= democracies since 1989. For country acronyms, see Table 2.
Figure 6 puts our evidence together. Here we see the mean age ratios for institutionalised and non-institutionalised participation in one graph. Where the two lines meet, a hypothetical country would show no difference in participation levels between older and young people in any of the two dimensions. Iceland comes closest to this point. In institutionalised participation, Icelandic older people are a little bit more active than Icelandic young people. After Iceland, Sweden comes closest to this two-dimensional parity. In non-institutionalised participation, it is the other way around. There are four countries where institutionalised participation is almost the same across age groups, but there are also sizeable differences in non-institutionalised participation in favour of young people. These are Belgium, Estonia, Finland and Spain. Britain shows a pattern of relatively small differences in non-institutionalised participation but very strong differences in institutionalised participation. Older British people are not very far from young British people in non-institutionalised participation. However, they are much more active in institutionalised forms of participation. Lithuania is the most unequal in terms of both measures. Older people in Lithuania are much more active than young people in institutionalised forms of participation and much more inactive in non-institutionalised participation. In other words, older and young people in Lithuania differ completely in their patterns of political participation.
Figure 6: Scatter plot of mean age ratios institutionalised and non-institutionalised forms of participation 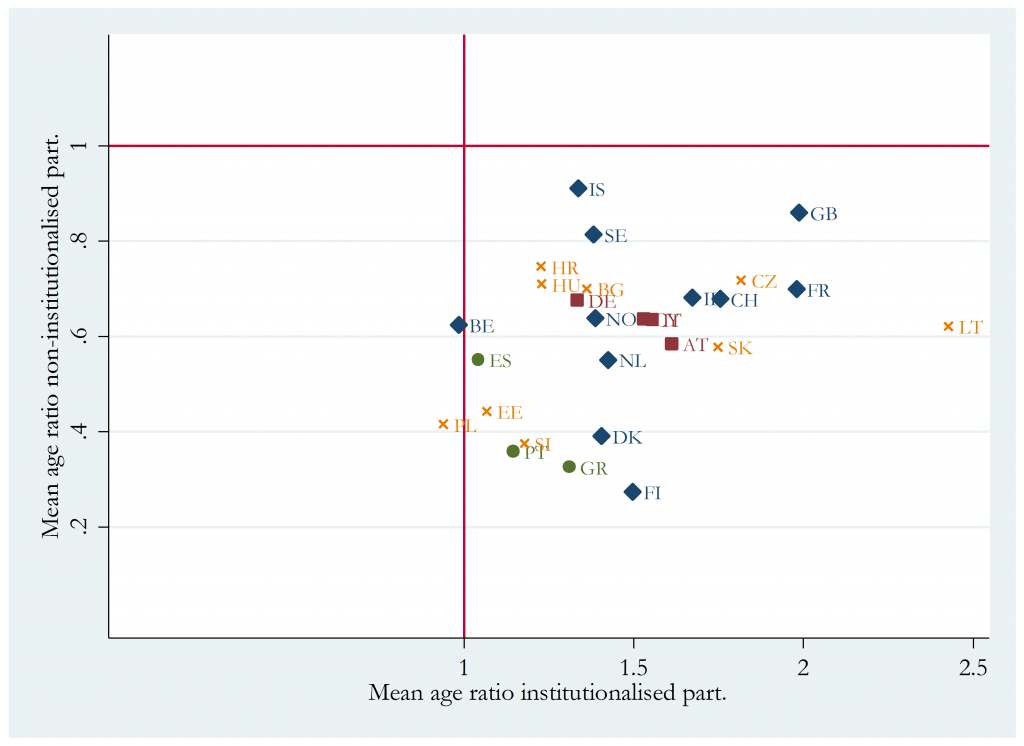 Diamonds=Democracies since before 1945, rectangles=democracies since after 1945 and before 1961, circles=democracies since the 1970s, crosses= democracies since 1989. For country acronyms, see Table 2.
To sum up the findings of this essay, older people’s political participation should be considered within a broader picture of mass political participation, since political participation is a multi-dimensional phenomenon. Most importantly, institutionalised participation through formalised routines of representative democracies is used more by older people than young people in many, but not all democracies. Exceptions include Belgium, Poland and Spain. Non-institutionalised forms of participation are characterised by a loose commitment outside of the formal channels of representative democracies. These are favoured more by young people, but in some countries like Iceland, the age gap is practically negligible. Across all modes of participation, there are a lot of differences between countries. Sometimes, there is a relationship between the levels of participation in a country and the size of the age gap. For example, in countries with higher turnout, the age gap in favour of older people is weaker. This pattern is often stratified by the age of a country’s democracy with more recently democratised countries showing lower levels of participation overall. Overall, 13% of older Europeans do not participate in politics at all and only 2% limit themselves to non-institutionalised forms of participation. This implies that 85% are firmly embedded in the electoral process.
Technical Appendix
The data are mostly taken from the Eurostat database and were provided by the team of the European Social Survey.
Estimates of participation rates and support for certain political stances are my own, based on waves 5 to 7 of the European Survey. They apply to the years 2010-14. The estimates are weighted by design weight to reflect differences in sampling techniques.
Note that the estimates are based on reported behaviour. Since citizens know that democratic participation is socially desirable, some respondents indicate their having complied with this expectation while actually not having done so in reality. This is due to conscious lying and more importantly to our inner subconscious urge to be consistent with our own image of ourselves and our behaviour.
Table 6: Full table of estimates on contacting a public official
|
Country Name
|
Country Code
|
Overall
|
Level among older people (60+)
|
Level among middle-aged (30-59 yrs)
|
Level among young (18-29 yrs)
|
Ratio old by young
|
|
Lithuania
|
LT
|
8
|
7
|
11
|
3
|
2.78
|
|
Czech Republic
|
CZ
|
13
|
14
|
14
|
6
|
2.19
|
|
France
|
FR
|
14
|
14
|
17
|
6
|
2.17
|
|
Slovakia
|
SK
|
9
|
10
|
10
|
5
|
2.16
|
|
Italy
|
IT
|
16
|
16
|
19
|
8
|
2.06
|
|
Britain
|
GB
|
17
|
19
|
18
|
9
|
2.06
|
|
Switzerland
|
CH
|
16
|
15
|
18
|
8
|
1.83
|
|
Austria
|
AT
|
19
|
20
|
20
|
12
|
1.75
|
|
Finland
|
FI
|
20
|
18
|
24
|
11
|
1.71
|
|
Sweden
|
SE
|
18
|
18
|
20
|
11
|
1.63
|
|
Denmark
|
DK
|
19
|
18
|
23
|
11
|
1.62
|
|
Cyprus
|
CY
|
17
|
15
|
21
|
9
|
1.59
|
|
Netherlands
|
NL
|
17
|
16
|
18
|
10
|
1.58
|
|
Norway
|
NO
|
22
|
20
|
27
|
13
|
1.55
|
|
Ireland
|
IE
|
17
|
19
|
18
|
13
|
1.51
|
|
Germany
|
DE
|
17
|
16
|
18
|
11
|
1.47
|
|
Bulgaria
|
BG
|
5
|
5
|
5
|
4
|
1.38
|
|
Greece
|
GR
|
9
|
7
|
11
|
5
|
1.38
|
|
Iceland
|
IS
|
28
|
26
|
31
|
19
|
1.33
|
|
Hungary
|
HU
|
8
|
7
|
10
|
6
|
1.25
|
|
Belgium
|
BE
|
15
|
12
|
17
|
12
|
1.00
|
|
Slovenia
|
SI
|
10
|
9
|
12
|
9
|
0.92
|
|
Portugal
|
PT
|
8
|
7
|
9
|
7
|
0.90
|
|
Spain
|
ES
|
15
|
9
|
18
|
11
|
0.86
|
|
Estonia
|
EE
|
14
|
10
|
17
|
13
|
0.81
|
|
Poland
|
PL
|
8
|
5
|
10
|
8
|
0.65
|
|
Croatia
|
HR
|
7
|
4
|
9
|
7
|
0.54
|
|
|
|
|
|
|
|
|
Mean
|
|
14
|
13
|
17
|
9
|
1.51
|
|
Minimum
|
|
5
|
4
|
5
|
3
|
0.54
|
|
Maximum
|
|
28
|
26
|
31
|
19
|
2.78
|
Figure 8: Full table of estimates on signing a petition
|
Country Name
|
Country Code
|
Overall
|
Level among older people (60+)
|
Level among middle-aged (30-59 yrs)
|
Level among young (18-29 yrs)
|
Ratio old by young
|
|
Britain
|
GB
|
34
|
30
|
37
|
29
|
1.03
|
|
Switzerland
|
CH
|
34
|
31
|
37
|
31
|
1.00
|
|
Sweden
|
SE
|
42
|
41
|
43
|
42
|
0.98
|
|
Germany
|
DE
|
35
|
29
|
39
|
31
|
0.95
|
|
Cyprus
|
CY
|
9
|
7
|
11
|
8
|
0.88
|
|
Bulgaria
|
BG
|
8
|
6
|
8
|
7
|
0.87
|
|
Iceland
|
IS
|
57
|
46
|
63
|
56
|
0.82
|
|
Czech Republic
|
CZ
|
18
|
13
|
20
|
17
|
0.81
|
|
France
|
FR
|
33
|
25
|
37
|
31
|
0.81
|
|
Austria
|
AT
|
29
|
25
|
31
|
31
|
0.79
|
|
Netherlands
|
NL
|
26
|
20
|
29
|
27
|
0.76
|
|
Hungary
|
HU
|
4
|
3
|
4
|
3
|
0.76
|
|
Belgium
|
BE
|
22
|
16
|
25
|
23
|
0.69
|
|
Ireland
|
IE
|
22
|
17
|
23
|
25
|
0.66
|
|
Norway
|
NO
|
35
|
27
|
37
|
42
|
0.64
|
|
Italy
|
IT
|
23
|
18
|
24
|
28
|
0.64
|
|
Croatia
|
HR
|
24
|
17
|
26
|
26
|
0.63
|
|
Slovakia
|
SK
|
21
|
15
|
22
|
25
|
0.62
|
|
Spain
|
ES
|
31
|
19
|
37
|
31
|
0.62
|
|
Denmark
|
DK
|
29
|
19
|
32
|
36
|
0.54
|
|
Lithuania
|
LT
|
9
|
5
|
11
|
12
|
0.44
|
|
Estonia
|
EE
|
9
|
5
|
11
|
12
|
0.43
|
|
Greece
|
GR
|
5
|
3
|
6
|
7
|
0.41
|
|
Slovenia
|
SI
|
9
|
5
|
11
|
13
|
0.39
|
|
Finland
|
FI
|
29
|
15
|
36
|
39
|
0.39
|
|
Poland
|
PL
|
11
|
6
|
12
|
16
|
0.38
|
|
Portugal
|
PT
|
8
|
4
|
10
|
12
|
0.29
|
|
|
|
|
|
|
|
|
Mean
|
|
23
|
17
|
25
|
24
|
0.67
|
|
Minimum
|
|
4
|
3
|
4
|
3
|
0.29
|
|
Maximum
|
|
57
|
46
|
63
|
56
|
1.03
|
Table 7: Full table of estimates on taking part in a demonstration
|
Country
Name
|
Country
Code
|
Overall
|
Level among older people (60+)
|
Level among middle-aged (30-59 yrs)
|
Level among young (18-29 yrs)
|
Ratio old by young
|
|
Iceland
|
IS
|
18
|
16
|
19
|
16
|
1.00
|
|
Croatia
|
HR
|
8
|
6
|
9
|
7
|
0.86
|
|
Lithuania
|
LT
|
3
|
2
|
3
|
3
|
0.80
|
|
Ireland
|
IE
|
11
|
9
|
10
|
14
|
0.70
|
|
Britain
|
GB
|
4
|
3
|
4
|
4
|
0.69
|
|
Hungary
|
HU
|
3
|
2
|
4
|
4
|
0.66
|
|
Sweden
|
SE
|
8
|
7
|
7
|
11
|
0.65
|
|
Norway
|
NO
|
10
|
7
|
11
|
11
|
0.64
|
|
Italy
|
IT
|
16
|
14
|
16
|
22
|
0.64
|
|
Czech Republic
|
CZ
|
6
|
4
|
6
|
6
|
0.63
|
|
France
|
FR
|
14
|
10
|
16
|
16
|
0.59
|
|
Belgium
|
BE
|
6
|
3
|
8
|
6
|
0.56
|
|
Slovakia
|
SK
|
3
|
2
|
3
|
4
|
0.53
|
|
Bulgaria
|
BG
|
4
|
3
|
5
|
5
|
0.53
|
|
Spain
|
ES
|
22
|
13
|
25
|
28
|
0.48
|
|
Estonia
|
EE
|
3
|
2
|
3
|
5
|
0.46
|
|
Poland
|
PL
|
2
|
2
|
2
|
4
|
0.45
|
|
Portugal
|
PT
|
5
|
3
|
6
|
7
|
0.43
|
|
Germany
|
DE
|
9
|
6
|
9
|
14
|
0.41
|
|
Cyprus
|
CY
|
5
|
2
|
5
|
6
|
0.40
|
|
Austria
|
AT
|
7
|
4
|
8
|
11
|
0.38
|
|
Slovenia
|
SI
|
3
|
1
|
4
|
4
|
0.36
|
|
Switzerland
|
CH
|
5
|
2
|
5
|
7
|
0.36
|
|
Netherlands
|
NL
|
3
|
1
|
3
|
4
|
0.34
|
|
Denmark
|
DK
|
6
|
3
|
6
|
11
|
0.25
|
|
Greece
|
GR
|
10
|
4
|
11
|
17
|
0.24
|
|
Finland
|
FI
|
2
|
1
|
2
|
4
|
0.16
|
|
|
|
|
|
|
|
|
Mean
|
|
7
|
5
|
8
|
9
|
0.53
|
|
Minimum
|
|
2
|
1
|
2
|
3
|
0.16
|
|
Maximum
|
|
22
|
16
|
25
|
28
|
1.00
|
REFERENCES
Franklin, Mark N. 2004. Voter Turnout and the Dynamics of Electoral Competition in Established Democracies. Cambridge: Cambridge University Press
Goerres, Achim. 2007. „Why are Older People more Likely to Vote? The Impact of Ageing on Electoral Turnout in Europe.“ British Journal of Politics and International Relations 9 (1):90-121.
———. 2009. The Political Participation of Older People in Europe: The Greying of Our Democracies. Basingstoke: Palgrave Macmillan.