
This essay is the third in a series written by Achim Goerres for the project “Ageing Democracies? Political Participation and Cultural Values Among the Elderly in Europe” financed by the Open Society Foundation. The complete project report with all essays and the reports written by the other project members can be found here.
One of the great myths about ageing and older people in politics is that individuals become more conservative with age. There is the commonly known bon mot that “if you’re not a liberal when you’re 25, you have no heart. If you’re not conservative by the time you’re 35, you have no brain.” This saying, which cannot be traced unequivocally to one source but seems to have been expressed first with slightly different age groups and adjectives by John Adams in a 1799 diary entry, seems to ring a bell with many observers of our European societies (Shapiro 2011).
The simple and, to some people, very appealing idea behind this is plainly wrong. Yet there seems to be something intuitively accurate about the phrase, which might explain why it has lasted so long despite the fact that there are very concrete empirical problems with it. In modern Europe, the period between an individual’s twenties and thirties is one of many changes for many people. They settle into their jobs, maybe they start a family, they start using different services provided by the public and private sector. Thus, it seems to make sense that political preferences change, too, during this period.
To begin with, political conservatism can mean several things. It can mean a generally held belief or a set of political values that are called “conservative”. Political science differentiates between two dimensions along which political preferences are usually grouped in Europe and to which political parties and candidates respond in terms of what they offer voters. The first is the economic dimension, which is associated by most people in Europe with the idea of left and right. Individuals who are more leftist on this dimension tend to believe in a strong role of the state in regulating the economy and redistributing between various social groups, most importantly from the rich to the poor. People who are more rightist on the economic dimension tend to believe in a lean role of the state both in regulating the market and in redistribution. The second dimension is the cultural one. People who are leftist here tend to support diversity with regard to sexual orientation, religion, ethnic background, language and other defining markers, and believe that the state should provide regulations to allow such diversity. Those on the cultural right are more supportive of a dominant way of living one’s life that is typically linked to a specific and narrow set of markers, such as one ethnic origin, one type of religion and one family structure. These two dimensions are not fully independent from another. Those people who are more conservative economically tend to be more conservative culturally, the relationship between the two dimensions is, however, not very strong. This is the reason why it makes sense for parties to explore the full two-dimensional room on these dimensions. For instance, the Dutch left-liberal party D66 (Democraten 66) and the right-liberal party VVD (Volkspartij voor Vrijheid and Democraties) are both economically conservative, but they differ on the cultural dimension with the D66 being more progressive culturally than VVD.
We can analyse these dimensions of political values by looking at some public opinion data from 2010 to 2014 from the European Social Survey. To measure the economic dimension, we will use support for the idea that the government should redistribute from the rich to the poor.
Table 1 shows the two demographically oldest European societies and the two youngest alongside support for the above statement as expressed in the European Social Survey. The first column shows estimated support across all age groups, the second the level of support among the 60+ group, the third the level among those under 30 and the last column the ratio of column 2 to 3. Again, if the ratio stands at one, there is no difference in support levels between the two age groups.
In Germany, 70% of the adult population think that the state should redistribute from the rich to the poor, while 73% of older people and 70% of young people think so. So, in Germany, younger people are actually more likely to be economically conservative than older people, but only very slightly. Older people are 1.04 times more likely to be supportive of redistribution than young people. The same pattern prevails in Italy, which is demographically the most similar society to Germany in Europe. It also holds in Ireland and Slovakia, the two youngest societies in our sample.
Table 1: Support for income redistribution by age group
[table id=6 /]
Let us now look at the cultural dimension. Table 2 shows similar evidence about whether individuals support the idea that homosexuals should be able to live as they want. The numbers are levels of support for the culturally progressive position. In Germany, for example, 85% of the adult population believe that homosexuals should live their lives as they wish, while 77% of older people and 88% of young people believe the same. Older people are thus 12% less likely to support this view. All four countries show the same inter-age group pattern, namely that older people tend to be culturally more conservative than young people. The only striking difference in Table 2 is between Slovakia and the other three countries, since Slovakia has a strongly culturally conservative populace with stark age group differences and an age ratio of 0.50.
Table 2: Support for free expression of homosexual life styles in two oldest and youngest democracies
[table id=7 /]
Figure 2 gives us an overview of all European countries in terms of the differences between older and young people with respect to the economic and cultural views described above. The picture is divided by the two parity lines at the value 1. The biggest quadrant is to the top left: older people are economically less and culturally more conservative than young people. Four countries deviate from this pattern: Austria, Switzerland, Great Britain (i.e., United Kingdom without Northern Ireland) and the Netherlands. In the first three, older people are on average both economically and culturally more conservative than young people. In the Netherlands, however, older people are less conservative than young people on both dimensions, although only slightly so in the cultural dimension.
The countries are also marked by different symbols depending on their time of democratisation. Those countries that have been democratised before or slightly after World War II tend to show a smaller age ratio in the cultural dimension than the other countries. This means that the difference between older people and the young in terms of the cultural dimension is much smaller in more established democracies.
In a nutshell based on our measures, older people are on average and in most European countries economically less conservative than young people. They are also culturally more conservative, broadly, than their young country peers.
Are there any explanations for these patterns? First of all, the distribution of certain social characteristics is different among the elderly than it is among younger people. For instance, the group of older people is more female than younger groups due to gender-specific mortality rates and less well educated due to recent expansions of educational possibilities. Being female and lower educated are both associated with less economic conservatism than being male or higher-educated. At the same time, women and lower educated people are also less likely to be economically conservative, supporting the notion that the differences observed may be due to the composition of the groups.
Figure 1: Age ratios of support for redistribution (economic progressivism) and support for diversity of sexual orientation (cultural progressivism)
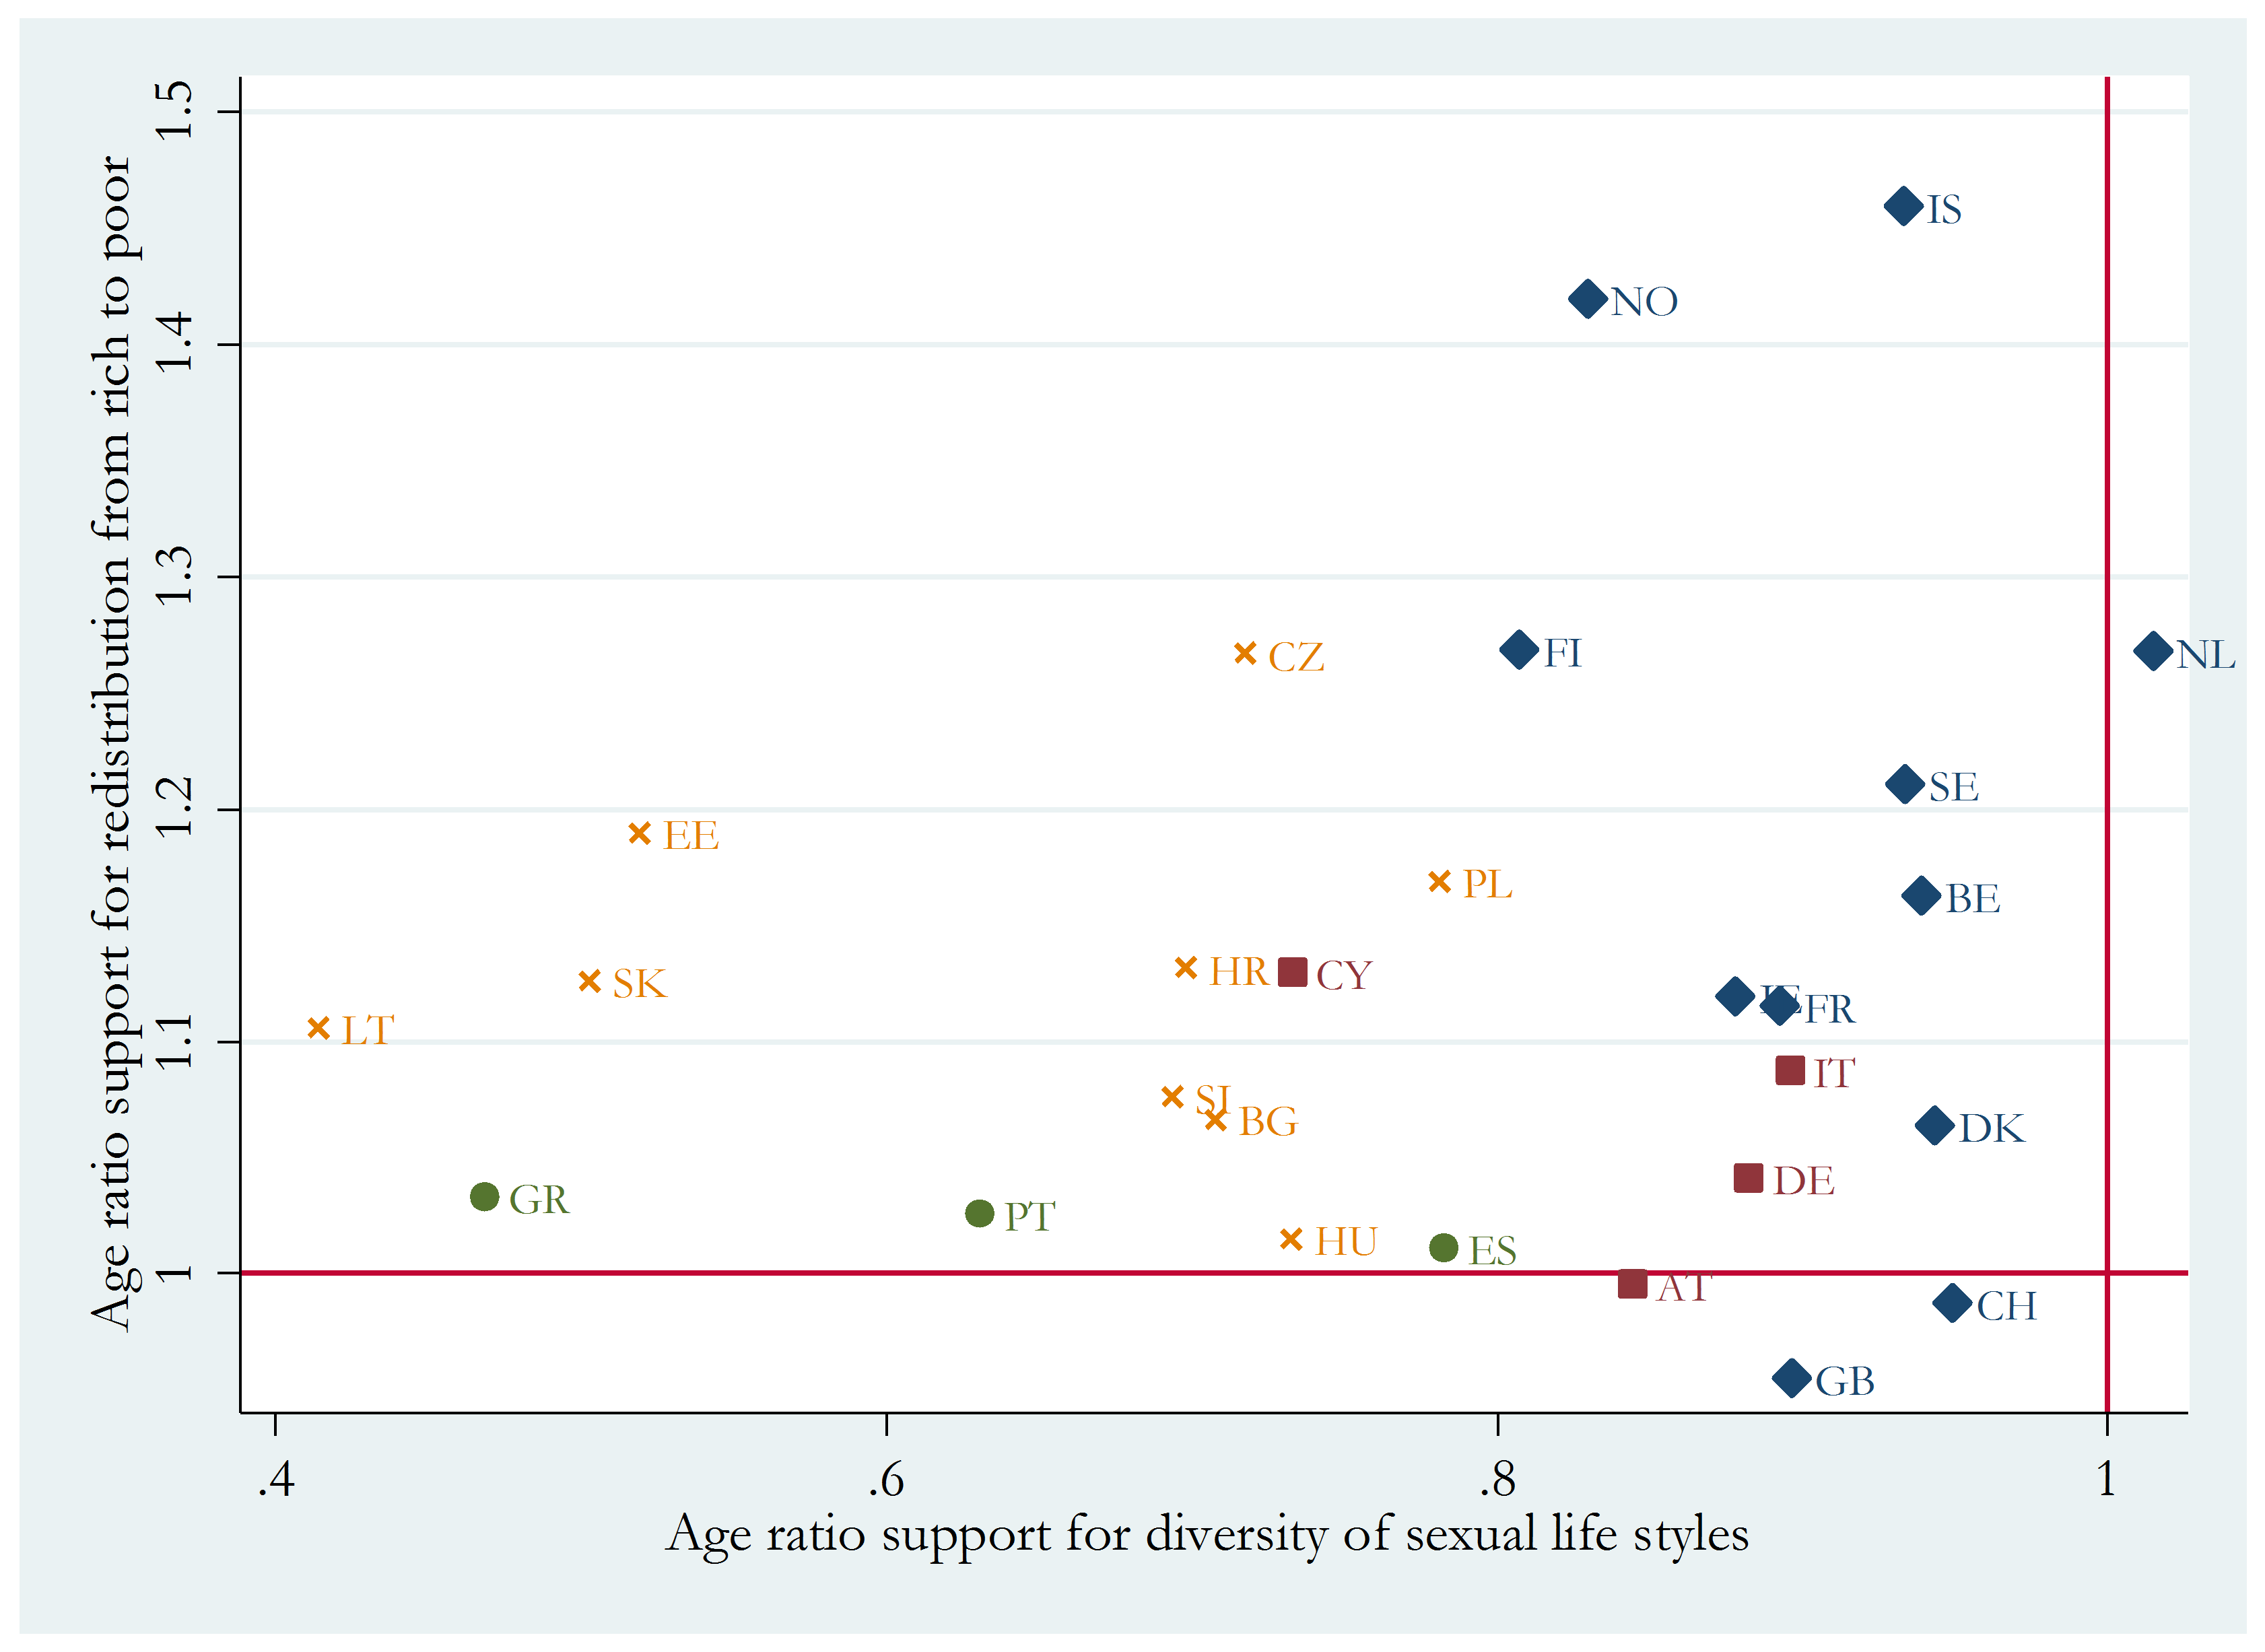 Legend: Diamonds=Democracies since before 1945, rectangles=democracies since after 1945 and before 1961, circles=democracies since the 1970s, crosses= democracies since 1989. For country acronyms, see appendix.
There are further explanations for age-related differences with regard to political values. Most importantly, older people are members of a different cohort than younger people. This means that individuals who grew up during the same time, given the same historical context, share similar experiences that shapes them in late adolescence and early adulthood. Political scientists use the term “political generations” to refer to causal mechanism. These common experiences are tremendously shaped by national circumstances and political history. Being a member of a birth cohort in one country can shape an individual rather differently than being the member of the same birth cohort in another country. If these experiences were all idiosyncratic to a national context, we would not see such a common pattern across countries. Instead, there are some cohort experiences that have a similar political effect across European countries. World War II and its aftermath is one such common experience. We know that the experience of death and violence in World War II shaped the collective experience in Eastern Europe and the longing for safety in the European Union.
More importantly in the context of our discussion about conservatism, there have been broad developments in Europe that shaped the ways in which members of different cohorts relate to politics. One of these broad developments is socio-economic modernisation and democratisation (Inglehart 1997). This is a broad development at the social, economic and political level through which individuals grow more individualistic, more cosmopolitan and more accepting of diversity. This development catches cohorts differently, such that it is mostly those cohorts whose members are still young and can still be shaped by this change. When we look at a snap shot of younger and older people as we did with our data, this can explain the varying degrees of cultural conservatism among older people. Their cohorts have been less impacted by this development than cohorts of younger people. Thus, it is not a coincidence that the richer and, according to this theory, socio-economically more developed countries in Europe (Western Europe) tend to be more on the right of the x-axis in Figure 1. The further along societies are in the process of socio-economic development, the smaller the gap in cultural conservatism between younger and older people is. Lithuania, Greece, Estonia and Slovakia show culturally much more conservative older people relative to younger people in their countries because they are, according to this theory, less developed (with GDP per capita being a simple indicator of that). Iceland, the Netherlands and Belgium, in contrast, show a rather low level of difference.
This co-evolution with socio-economic development is remarkable because the social status of older people tends to decline with increasing modernisation. In pre-modern society, the social status of older men (not women!) as the heads of households was still high (Foner 1984). This status declined with increasing industrialisation and was finally removed altogether with the introduction of the modern welfare state, which allowed all individuals to seek their own material fortunes without the family having to be the main safety net.
In other words, if older people are more conservative than younger people, this is much more likely due to their cohort membership than to where they are in the life cycle. But these differences are not stable across time. For instance, analyses of the Brexit vote in the United Kingdom demonstrate that older people in 2016 were much more likely to vote for the Leave option than for the Remain option, most likely because older people belonged to cohorts that were more fond of the traditional nation-state than the supranational structure of EU governance (Goodwin and Heath 2016; Hobolt 2016).
So, is there anything left to say about older people and conservatism? There is some evidence about voters being more open to newer parties in the first elections of their lives. Later, if these parties do not make it into the establishment, they tend to shift to more established parties. As voters have had more opportunities to cast a vote, they grow increasingly disenchanted with wasting their votes on new parties. However, this effect, which one might call status-quo conservatism, is small and can only be demonstrated for countries with proportional representation systems (Goerres 2009).
Appendix
Table 3: Support for income redistribution by age group
[table id=8 /]
Table 4: Support for free expression of homosexual life styles
[table id=9 /]
References
Foner, Nancy. 1984. Ages in Conflict: A Cross-Cultural Perspective on Inequality between Old and Young. New York: Columbia University Press.
Goerres, Achim. 2009. The Political Participation of Older People in Europe: The Greying of Our Democracies. Basingstoke: Palgrave Macmillan.
Goodwin, Matthew J, and Oliver Heath. 2016. „The 2016 Referendum, Brexit and the Left Behind: An Aggregate‐level Analysis of the Result.“ The Political Quarterly 87 (3):323-32.
Hobolt, Sara B. 2016. „The Brexit Vote: a Divided Nation, a Divided Continent.“ Journal of European Public Policy 23 (9):1259-77.
Inglehart, Ronald. 1997. Modernization and Postmodernization. Cultural, Economic, and Political Change in 43 Societies. Princeton: Princeton University Press.
Shapiro, Fred. 2011. John Adams Said it First [cited 18 April 2017].